Insight

Market dynamics has become crucial and the importance of sell-out data analysis rapidly increases.

Apart from gathering retailers data, the import still can be a challenging task due to the diverse formats and structures from the different channels. Manual processing of these files often leads to time-consuming and error-prone tasks. Polygram Insight addresses these challenges by offering a robust data import solution that seamlessly processes retailer raw data, regardless of its format. The goal is to eliminate the need for manual work and ensuring accurate and efficient data analysis by converting them into unified format. No more manual work on retailer raw Excel files. 

Polygram Insight offers both manual and automated sales, returns and stock data processing to gain a competitive advantage on the market. This accelerated reaction time allows you to adjust strategies, optimize operations, identify growth opportunities, and maintain a competitive edge in an ever-evolving market. Read more how easy to handle this mission.

Data import

1-click upload

Simply select and upload your retailer sell-out and/or stock data files. Excel, CSV, XML, and so many other formats are supported.

The tailored Insight import solution automatically detects the data format, ensuring seamless integration and eliminating the need for any tedious manual work.

Validation

Instant feedback

After uploading data, Insight validates the product information and only accepts data rows where the product was identified by one of the IDs, like item number, EAN code or model name. It automatically checks cross-referencing for multiple IDs whatever is provided. 

In the rare event that some products are unrecognized, Insight provides you with a clear and concise table highlighting these entries. This allows you to quickly identify any missing or inconsistent data, empowering you to take corrective actions. This way, you can ensure data accuracy and completeness at zero time.

OR

Optional

Review

Allows you to optionally inspect the uploaded data in a user-friendly, comprehensive table, organized by the selected retailer and period.

From here, you have the flexibility to manage the data with ease. Choose to delete all data for a specific partner and period, or selectively remove entries for sales, returns, or stock.

Mission

Overview

The overview component provides a clear snapshot of your uploaded sell-out and stock data. It allows you effortlessly track and monitor the progress of your business by quickly identifying which periods and partners have data uploaded.

Polygram Insight in action

Case studies

Some examples how Insight sell-out monitoring can empower your business to achieve remarkable outcomes.

Online or offline

The proportion of e-shoppers grew from 55% in 2012 to 75% in 2022, an increase of 20 percentage points. How about you business? Here are few ideas why using online-offline comparison helps you:

Brand performance

polygram-explore-pie-chart

Brand performance is an indicator, showcasing a brand or sub-brand success and popularity. Usually, it measures a brand’s results against multiple factors, like:

  1. Against other brands, or sub-brands in multi-brand business.
  2. Against company goals. For example, how the branding aligns with business and marketing goals.
  3. Assessment of brand performance in relation to competitors. E.g., market positioning, brand awareness.
  4. Identifying segments which priors certain brands over other brands.

Stock rotation

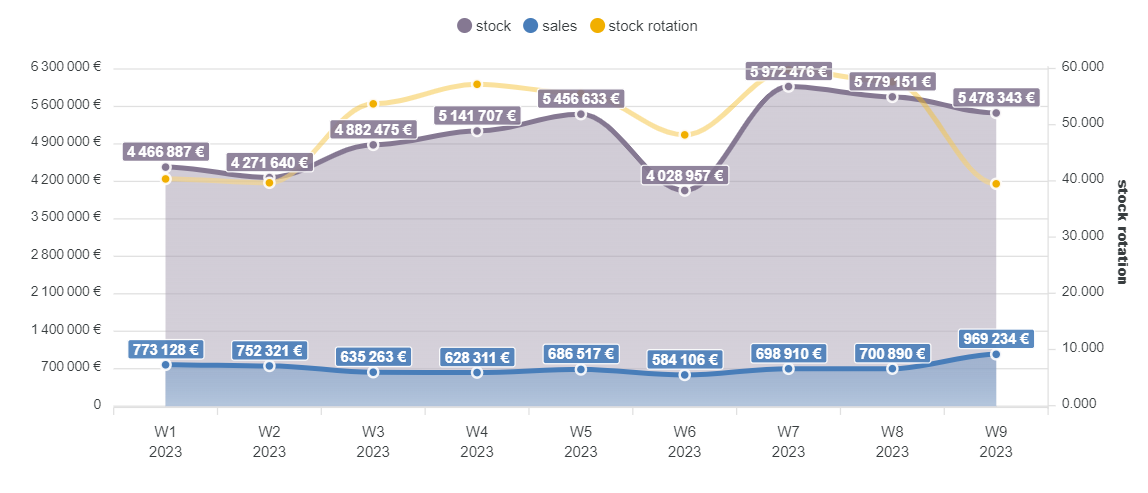
Stock rotation acts as a preventive measure against stock loss. It refers to the practice of regularly replenishing or replacing inventory to ensure that older or slower-moving items are sold before they become obsolete or unsellable. By rotating stock, businesses can maintain product freshness, reduce the risk of obsolescence or spoilage, optimize warehouse space utilization, and improve cash flow.

Year Over Year

In financial analysis, the YoY (year-over-year) comparison is a valuable tool for evaluating a business’s performance in a particular category by measuring the difference from the previous year. This approach enables the identification of financial trends when analyzing product sell-out or stock level.

Try Polygram

These are only few use cases. 
Do you have more ideas?